Measurement · 6 September 2026 · 7 min read
What your wearable's HRV score actually means
Oura, Garmin, Apple Watch and Whoop all report an HRV score, and they rarely agree. Why the numbers differ, what a drop after a late night is telling you, and how a clinic reading is different.
By Dr Arthur Kaganovitch (Chiropractor)
Updated 7 September 2026
Most people who ask us about heart rate variability have already met the term on their wrist. Oura, Garmin, Apple Watch and Whoop all now report an HRV score, usually with a colour, a trend arrow and some sense that today’s number is either good news or bad news. It is a genuinely useful habit to be tracking. It is also, on its own, a much blurrier picture than the app makes it look.
Why the brands disagree with each other
If you have ever worn two devices at once, you will have noticed they rarely report the same HRV number, sometimes not even close. Part of that is legitimate: there is more than one accepted way to calculate HRV from a stream of heartbeats, and time-domain and frequency-domain methods can produce meaningfully different figures from the same underlying data.[1] We explain that split in plain terms in our HRV explainer.
Layered on top of that is the practical difference in how each device actually measures you. Some read HRV continuously overnight and report a single overnight average. Others take short spot readings during the day. Wrist-worn optical sensors, the kind used in almost every consumer wearable, are also simply less accurate than the chest strap or clinical electrocardiogram methods that the research standards were built around, with accuracy that can shift depending on skin tone, motion, and how snugly the device sits.[3] Each brand then runs its own proprietary algorithm over that raw signal to produce the single score you see, and none of those algorithms are published or standardised against each other. Different measurement window, different sensor, different maths: three good reasons two devices on the same wrist can tell two different stories.
There is a further wrinkle worth knowing about. Most wearable HRV scores are not reporting the raw millisecond variation at all. They are reporting a proprietary index, often scaled to a range like naught to one hundred, that the manufacturer has built by weighing HRV alongside sleep stages, resting heart rate and other signals particular to that device. Two brands can start from similar raw data and still land on very different scores, simply because each has decided to weight those inputs differently. That is a reasonable design choice for a consumer app trying to give you one simple number each morning. It also means the score on your wrist and the raw HRV value a clinic reads are related but not the same measurement, and comparing one against the other directly is rarely a fair comparison.
Why the score drops after alcohol or a late night
This part of the story is well supported. Alcohol measurably reduces heart rate variability, and the effect is dose-related: more alcohol produces a larger drop, driven by a shift toward greater sympathetic, fight-or-flight influence on the heart and reduced parasympathetic activity overnight.[4] That is precisely why so many wearable users notice their HRV score fall the morning after drinking, even a moderate amount, and why sleep that is shortened or fragmented produces the same kind of dip: the nervous system spends the night working harder, and the wearable catches that.
None of this means the score is meaningless. It means it is doing exactly what it is designed to do, reporting a real physiological shift, which is precisely why chasing it can go wrong.
Why chasing the number backfires
A daily HRV score turns naturally into something to optimise, and that is where the habit can work against the thing it is meant to support. HRV is influenced by a long list of ordinary, harmless factors: what time you went to bed, whether you exercised late, how much you ate before sleeping, even the position you slept in. A single low reading is very often just noise, or a fair reflection of one ordinary night, not a verdict on your health.[1] Treating each morning’s number as a pass or fail grade, particularly for someone already prone to anxiety about their health, can itself become a source of the sympathetic activation the score is trying to detect. Watching a number that is meant to reflect a calm nervous system can be a very effective way to unsettle one.
There is also a simpler trap worth naming. A wearable score is reported against either your own recent history or a broad population range, depending on the brand, and it is easy to lose track of which one you are looking at. Comparing your reading to a population average, when your own healthy baseline sits above or below that average, will make a perfectly normal night look like a problem, or a genuinely poor night look unremarkable. The number is only useful once you know what it is being measured against.
How a clinic reading is different
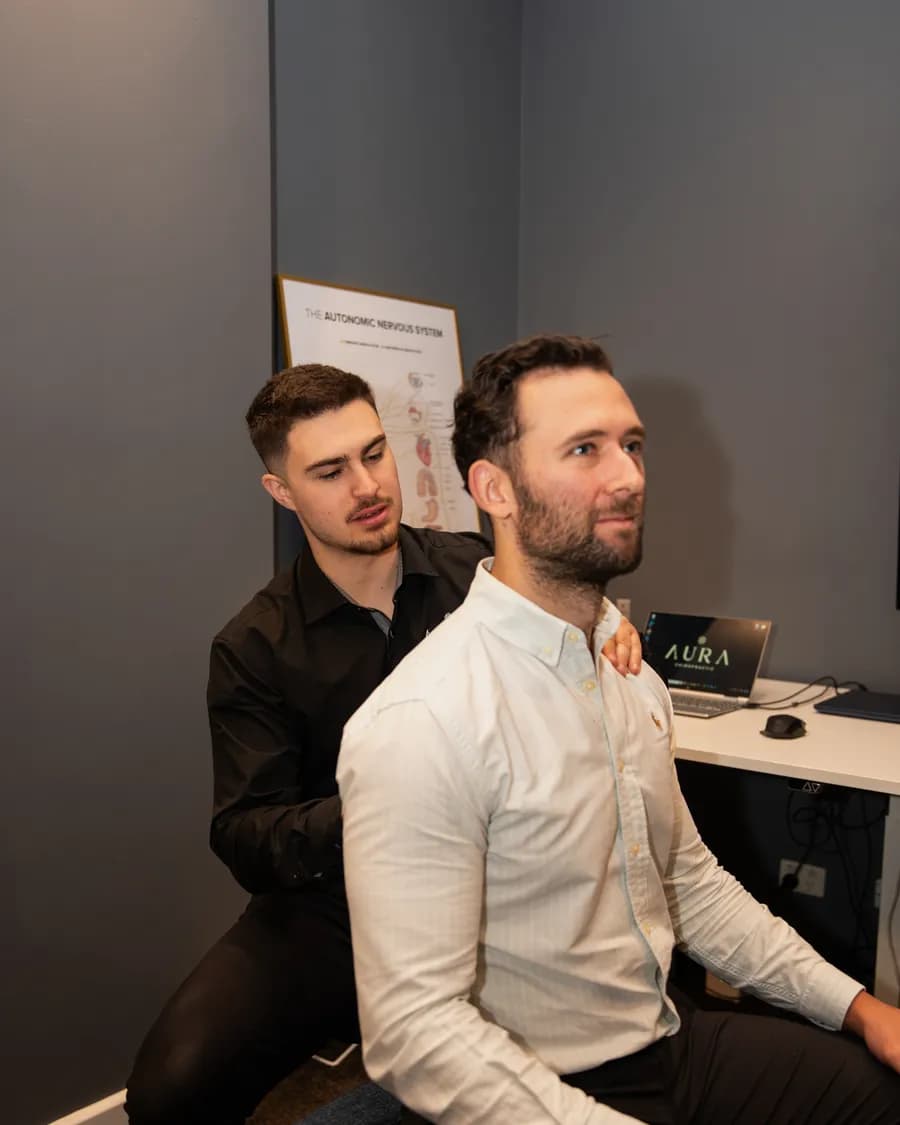
Dr Arthur Kaganovitch (Chiropractor), who founded Aura in Toorak, sees the wearable number and the clinic number as related but distinct tools. A wearable is tracking you continuously, in real life, across sleep, stress, alcohol, exercise and everything else, which is exactly what makes it useful for spotting a trend over weeks, and exactly what makes any single day noisy.
A clinic reading is built to remove that noise. It is taken at rest, in a standardised position, using a consistent method each time, which is what the original clinical HRV standards were designed around.[2] Rather than comparing you to yesterdayâs alcohol or last night’s sleep, we compare a resting reading against your own baseline over a course of care, tracking the direction it moves as the nervous system settles out of a protective pattern. It is a slower, steadier signal than a morning app score, and it is read alongside the rest of a full nervous system assessment, set out on our nervous system page, rather than in isolation. A wearable trend and a clinic baseline are not in competition. They are simply answering different questions, and stress that is dragging your daily number down is also part of a bigger picture we look at in cortisol and allostatic load.
A wearable tracks your week. A clinic reading tracks your baseline.
If your own number has you wondering what is actually going on underneath it, the way to find out is a proper assessment, not another app. Aura’s first visit includes a $99 Initial Assessment, ordinarily $189, for new patients, one per person, with no obligation to continue.
Sources
- 1. Shaffer F, Ginsberg JP. An Overview of Heart Rate Variability Metrics and Norms, 2017. View source
- 2. Task Force of the European Society of Cardiology and the North American Society of Pacing and Electrophysiology. Heart rate variability: standards of measurement, physiological interpretation, and clinical use, 1996. View source
- 3. Nelson BW, Allen NB. Accuracy of Consumer Wearable Heart Rate Measurement During an Ecologically Valid 24-Hour Period: Intraindividual Validation Study, 2019. View source
- 4. Spaak J, Merlocco AC, Soleas GJ, et al.. Dose-related effects of red wine and alcohol on heart rate variability, 2010. View source
This article is general information, not a diagnosis or a substitute for individual care. The population figures and guideline positions above are drawn from the cited sources. Observations attributed to Dr Arthur Kaganovitch (Chiropractor) reflect his clinical experience at Aura and are not claims of guaranteed outcomes.
Read more about how the nervous system drives symptoms and about the Aura Nervous System Reset.

Dr Arthur Kaganovitch (Chiropractor), Founder, Aura Chiropractic
I founded Aura Chiropractic with a clear purpose: to raise the standard of chiropractic and health care in Melbourne. My interest is the autonomic nervous system and how your own genetics shape the way your body carries stress.
About Dr Arthur